![]()
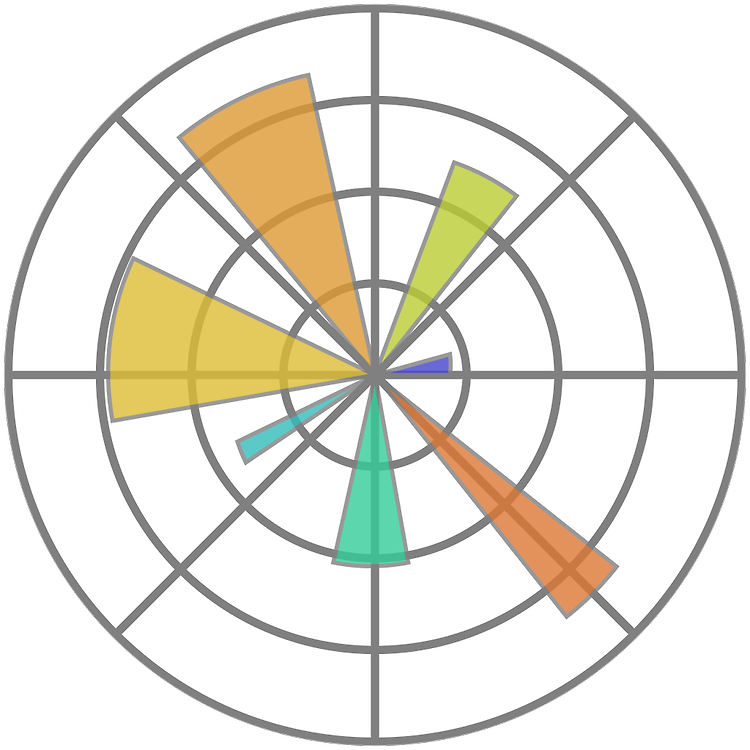
작성일자 : 2024-09-20수정일자 : 2024-09-22Ver 0.1.3참고 사이트 matplotlib.pyplot — Matplotlib 3.9.2 documentationmatplotlib.pyplot matplotlib.pyplot is a state-based interface to matplotlib. It provides an implicit, MATLAB-like, way of plotting. It also opens figures on your screen, and acts as the figure GUI manager. pyplot is mainly intended for interactive plots amatplotlib.org 그리기# 라이브러리 불러오기import matpl..
![]()
작성일자 : 2024-09-20Ver 0.1.1 Box PlotBox Plot은 요약 통계 세트를 사용하여 정량적 값의 분포를 요약한다. �Box Plot의 중앙값 눈금은 중앙값을 나타내며, 아래쪽과 위쪽은 각각 1분위와 3분위를 나타낸다. 상자 그림의 유형에 따라 수염의 끝은 여러 가지를 나타낼 수 있다.�Box Plot을 만들려면 mark_boxplot 메서드을 사용합니다.속성아래에 나열된 속성 외에도 상자, 중앙값, 규칙, 특이치 및 눈금을 사용하여 상자 그림의 여러 부분에 대한 기본 표시 속성을 지정할 수도 있다.속성유형설명�extendanyOf(string, number)The extent of the whiskers. Available options include:"min-max": min a..

